

Unidata IDV Workshop for version 7.0u1 > Accessing and Displaying Data > WSR-88D Level II Data Displays

3.5.5 Level II Isosurface Display
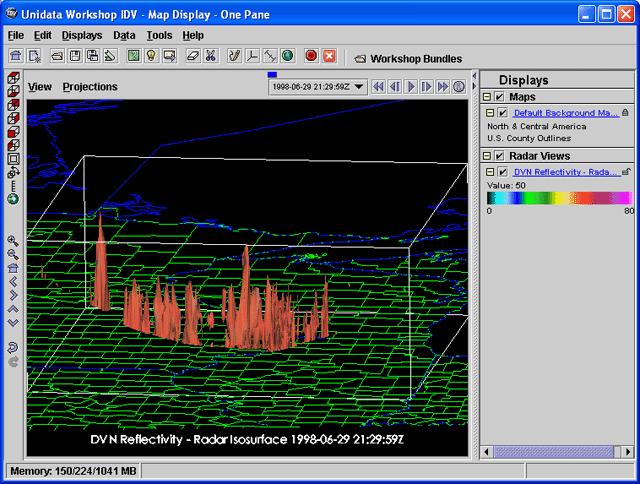
This IDV display shows isosurfaces of WSR-88D Level II volume scans.
If necessary, select Level II data and times as described in
Accessing WSR-88D Level II Radar Data.
- If other displays are in the main IDV window, select the
menu item or the
 icon in the toolbar to clear them out.
- If you have not already done so, select one time from the data source.
- Open the
Data Source Properties editor for Level II Radar Data (DVN).

- From the
Times tab,
select 1998-06-29 21:29:59Z time.
- Click the
OK button.
- In the
Field Selector window create a
Radar Isosurface display using the
Reflectivity field.
- See the Display in 3D
- A 3D display of the isosurfaces appears in the main window.
It is complex because the initial isosurface value is low, and there
are many low values in the display.
What are Radar Reflectivity Isosurfaces?
- Change the isosurface value to 50.0 dBZ
with the
Isosurface Value slider in the control window.
- Rotate, pan, and zoom in as needed to see the new display in 3D.
- What kind of weather system produced this radar result?
What are the vertical shapes with isosurface value 50.0 dBZ?
What does this arrangement of them mean?
The IDV's default view has vertical exaggeration.


Unidata IDV Workshop for version 7.0u1 > Accessing and Displaying Data > WSR-88D Level II Data Displays
 icon in the toolbar to clear them out.


