

| 2.7.0 | Connect to NOAA National Profiler Network data |
| 2.7.1 | Making the Profiler displays |
| 2.7.2 | Additional Profiler Displays |

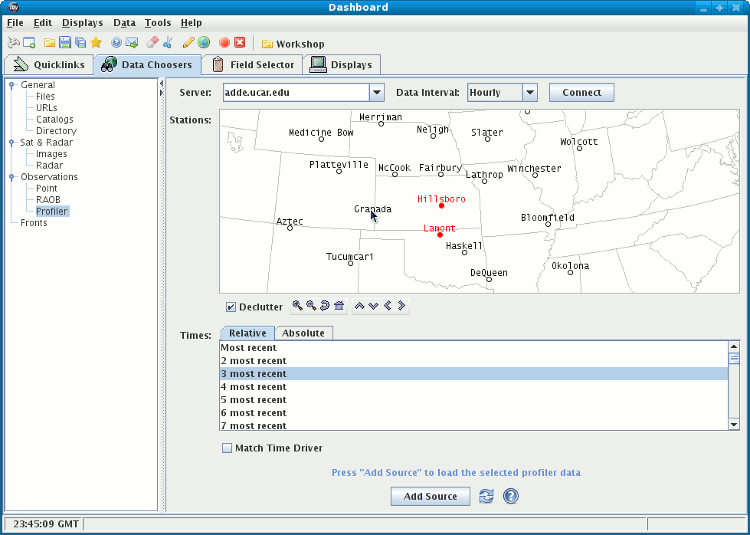
Data interval selection box you can choose from
Hourly, 30 minute, 12 minute, or 6 minute. The Profiler data has
a 6 minute interval; this selection lets you determine what time step
will be used in your IDV displays.
Click on Connect.
Some times first appear selected - highlighted. Check individual times on
or off with control-click. Select end times and times of a range
with shift-click.
Select a station by clicking on it on the map. Select a group of stations by dragging the mouse cursor with the shift key to make a rubber band box, or do shift-click to select more than one station. The map shows Profiler station names.
To see more stations check the Declutter box off,
The Declutter check box allows you to show all stations (not
checked), or only a limited number of stations that
do not overlap each other (checked).
More stations appear as you zoom in.
You may need to zoom in to see all the stations clearly separated.
The icons below the map allow you to zoom and pan.
Once you have selected one or more stations and a set of times,
click the Add Source button at bottom. You have selected
this data to be accessible by the IDV. (You have not yet downloaded any
profiler data to the IDV. Loading data occurs only when a display is made.)

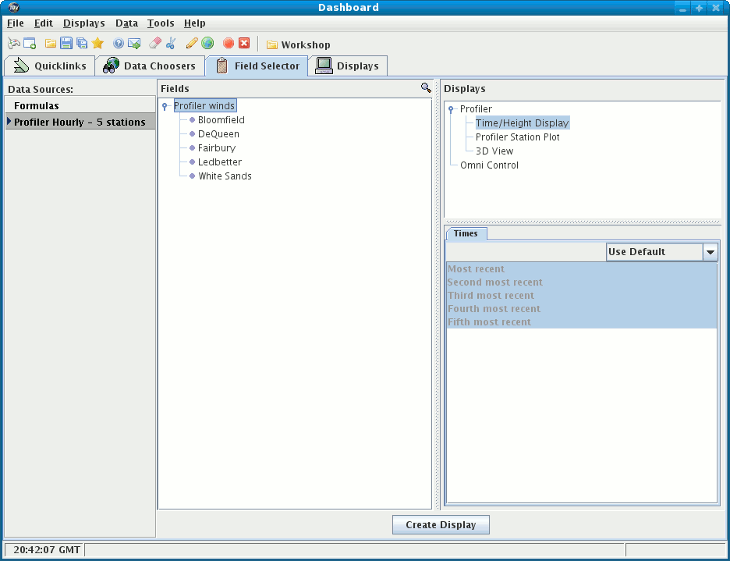
Click on "Time-Height Display" in the Displays panel, to choose this type of display. Then make the display by clicking on Create Display in the bottom of the Field Selector window.
The time/height plot of Profiler data at this station or stations is made. The colored globe in the lower right corner of the main IDV window indicates that processing and making displays is in progress.
Similarly you can choose the Station Plot Profiler display (a mapped plan view of profiler winds at any single level above sea level) , or the 3D View of Profiler data which shows winds at all levels and at all stations selected.