

 Unidata's Integrated Data Viewer > Getting Started

2.6 Skew-T Plot of RAOB data (Balloon soundings)
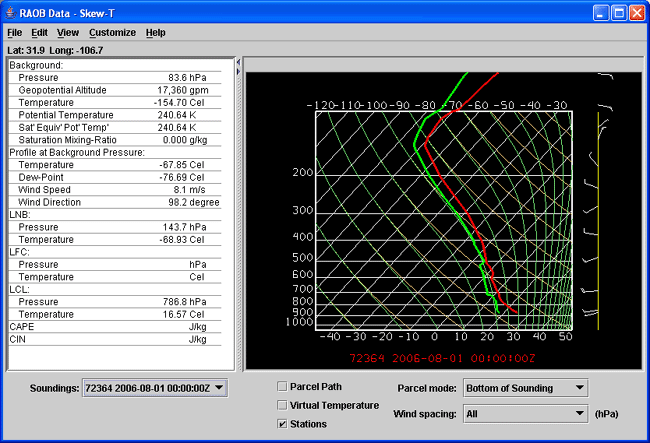
This section describes how to make a Skew-T plot from RAOB data:
 Image 1: RAOB Skew-T
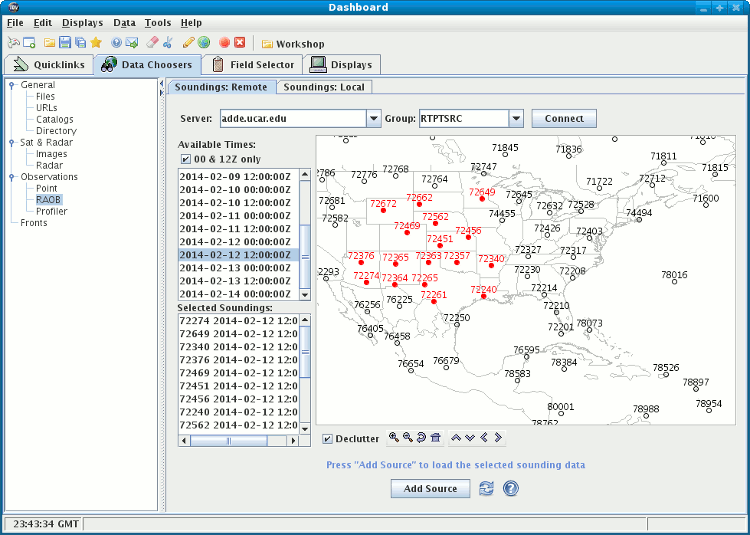
2.6.0 Choosing RAOB Data from a Remote Server
In the Data Source Chooser select the
RAOB tab.
For Server select adde.ucar.edu and click on Connect.
The Available times box fills in. Select the times you want
to use and then select the stations for those times.
You can select one or more by clicking on them; hold down the
Ctrl key to select more than one.
You can use the Declutter check box
to show all stations (not checked), or only a
limited number of stations that do not overlap each other (checked).
When in declutter mode you can zoom in (by dragging the left mouse)
to see more stations.
The icons below the map allow you to zoom and pan.
After you select stations,
the box Selected stations will populate with station numbers
and the selected data time.
When you have made your selection click the Add Source button.
2.6.1 Making the Skew-T Display
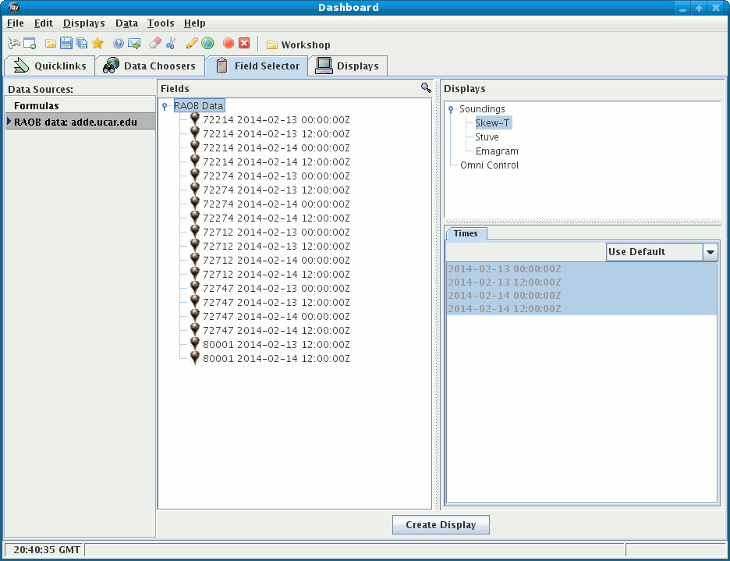
The RAOB data will be shown in the
Field Selector window.
Select "RAOB data" in the Field panel and "RAOB Skew-T"
in the Displays panel.
Make the Skew-T display by clicking on the Create Display button.
For more about the Skew-T and other aerological displays, see
Sounding Display and Controls.


 Unidata's Integrated Data Viewer > Getting Started


