

 Unidata's Integrated Data Viewer > Getting Started

2.5 Surface Observations - METAR and Synoptic Plots
This section describes how to create station model displays:
The set of steps include:
2.5.0 Selecting Surface Observations from a Remote Server
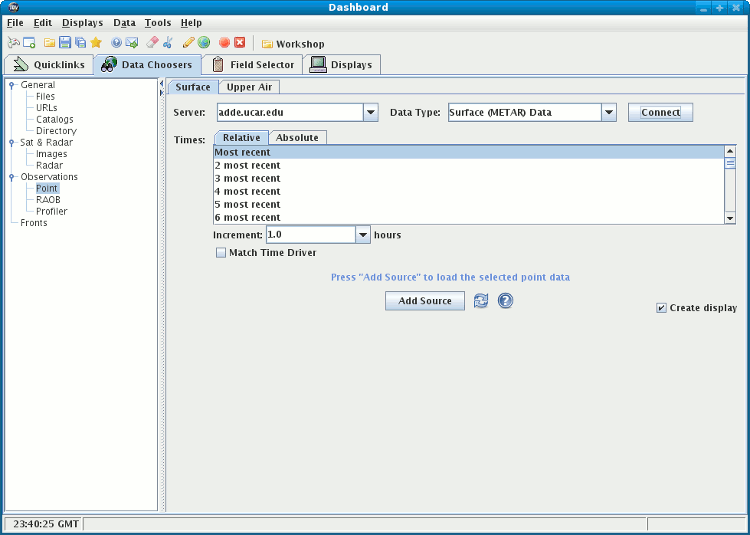
In the Data Chooser select the
Point tab.
In the Server: entry box, use the pull down list to select
a remote server with METAR data, such as adde.ucar.edu. You can also
type a different server name into the entry box.
In the Data type: selection box you choose between Surface
(METAR) Data and Synoptic data.
Click on Connect to find data on the remote server.
You can choose either the latest N times or select
specific time. Select the times you would like to view (note: multiple times
may be selected with the Shift and Control keys).
The Station Model selector allows you to select the preferred
plot type for this data. For this exercise, use the METAR
station model type. Click on Add Source when you have made
your selection.
2.5.1 Making the display
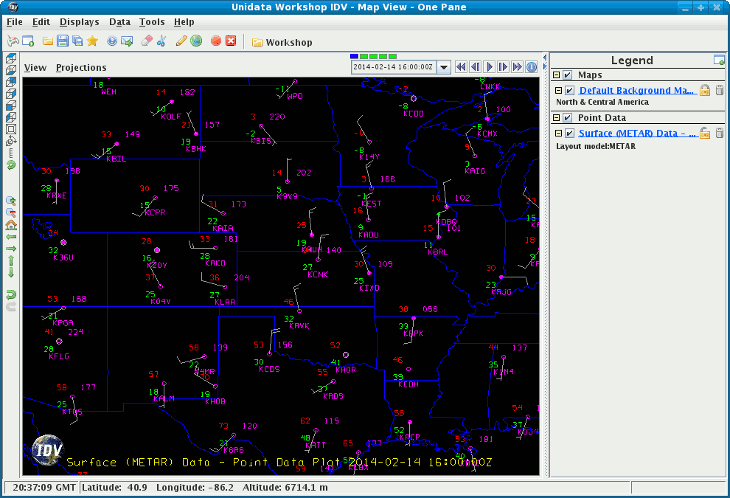
The surface observation data will be shown in the
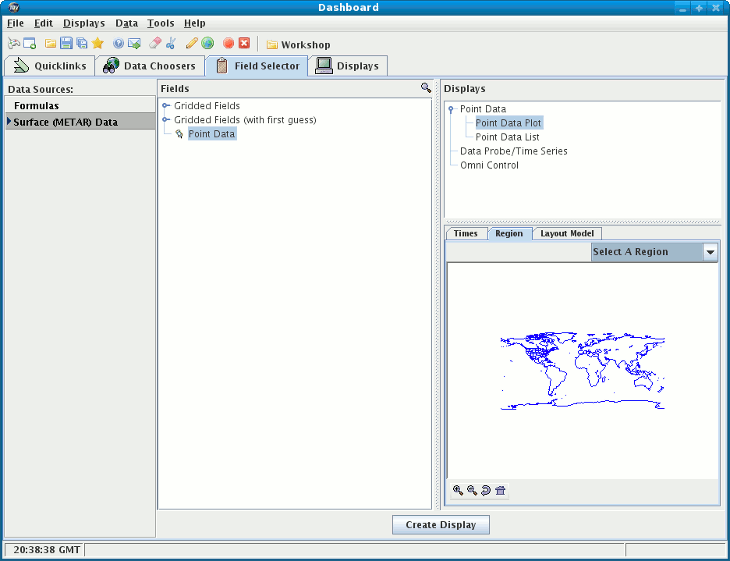
Field Selector window.
Select "Point Data" in the Field panel and select "Point Data
Plot" in the Displays panel.
Make the display by clicking on Create Display button on the bottom
of the Field Selector window.
To declutter the display, and to
change how the display elements at each station are selected and arranged,
use the
Station Model Control
and the
Station Model Editor.


 Unidata's Integrated Data Viewer > Getting Started


