

 Unidata's Integrated Data Viewer > Appendix > Examples of Display Types

8.0.8 Miscellaneous Display Types
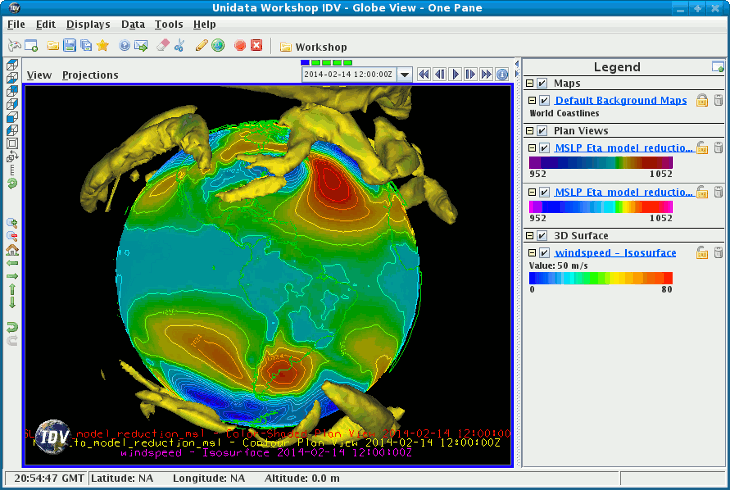
8.0.8.0 Globe Display
 Image 1: The Globe display
For more about this display and how to make it, see
Getting Started: Globe Display.
8.0.8.1 Multi-Panel Display
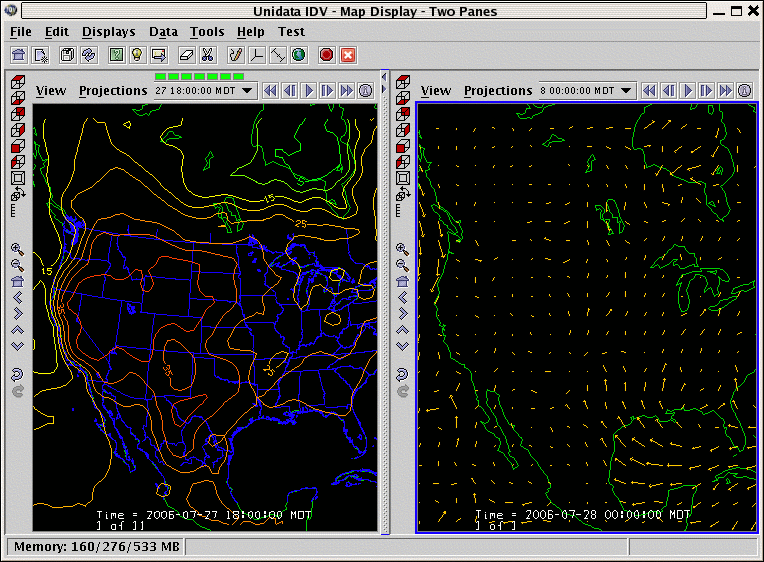
You can create multi-panel map and globe displays through
the menu. Below
is an example of a two panel display comparing visible
and IR satellite imagery.
 Image 2: Two Panel Map Display
8.0.8.2 Omni Display
The Omni display is a VisAD Spread Sheet, loaded with the
parameter selected and its coordinates and units. The Spread Sheet is
used to create a display where you have complete control over which
coordinates are the axes, how it is colored, and so on.
See more in the
Omni Control.
For use of the Spread Sheet, see the VisAD
Spread Sheet document at
http://www.ssec.wisc.edu/~curtis/ss.html.
8.0.8.3 HTML Viewer
The IDV has a window to display any HTML page. Any normal HTML page can
be presented, including ones accessed over the Internet, such as
https://www.unidata.ucar.edu/.
For the use of the IDV, special HTML tags are available to control the
IDV, including connecting to data sources and making displays.
You can compose an HTML page with named links to make pre-defined
displays from specified data. These can be used for class and lab exercises,
scientific reports, or even as simple user interfaces for special
purposes.
For example, you could make an HTML page, which when displayed using
the
IDV, offered a list of pre-defined common displays used by pilots at
an airport. Without knowing how to use the IDV the pilots could see
the weather information they need by simply clicking on items in the
HTML page. Similarly a field project can use the IDV with an HTML page
to view incoming data by single clicks on choices.
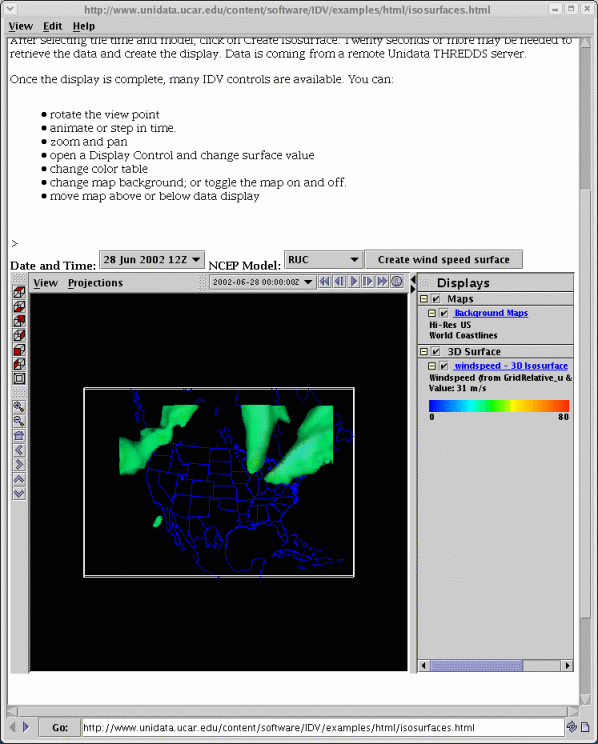
You can also add fully interactive IDV displays right inside
an HTML page. Special "IDV" tags in the HTML page
create IDV displays inside the HTML page, with all the
usual IDV display controls available.
Use of IDV displays inside an HTML document lets you create lab exercises,
tutorials, and scientific reports which include text, access to data
of any complexity or size, and fully interactive IDV displays. Your
readers can see the data you describe, and examine it themselves with
full interactivity,
when the HTML document is viewed with the IDV.
Since such HTML documents are not very large, they can be emailed
or made available for others to use online. Teachers can share HTML
files that drive the IDV for classroom use, reports, or simple user interfaces.
For more about creating and using IDV HTML pages, see
HTML and the IDV.


 Unidata's Integrated Data Viewer > Appendix > Examples of Display Types


