

 Unidata's Integrated Data Viewer > Appendix > Examples of Display Types

8.0.7 Observations
8.0.7.0 Point Data Displays
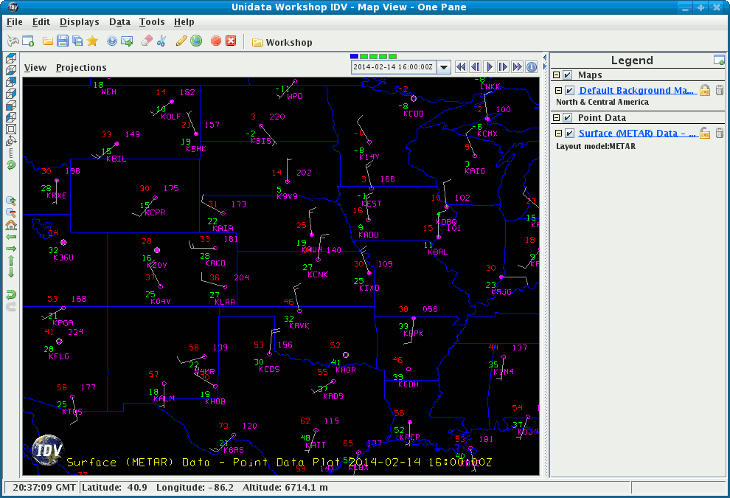
You can make plots of point data such as meteorological surface (METAR)
and synoptic surface weather station observations.
For more information see
Getting Started: Surface Observation Plots.
You can change the plot layout with the
Station Model Editor.
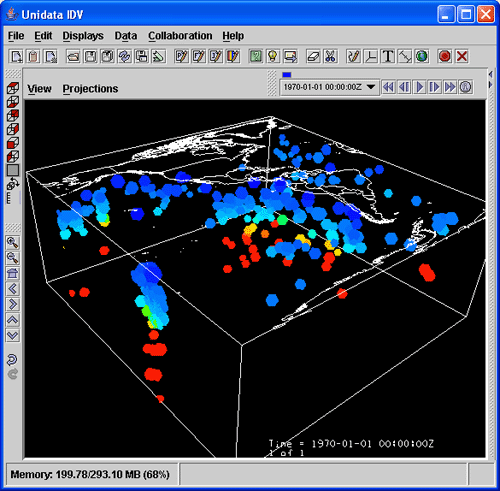
You can plot non-meteorological point data as well. The image below depicts
the locations of earthquakes, sized by magnitude and colored by depth.
8.0.7.1 Track Displays
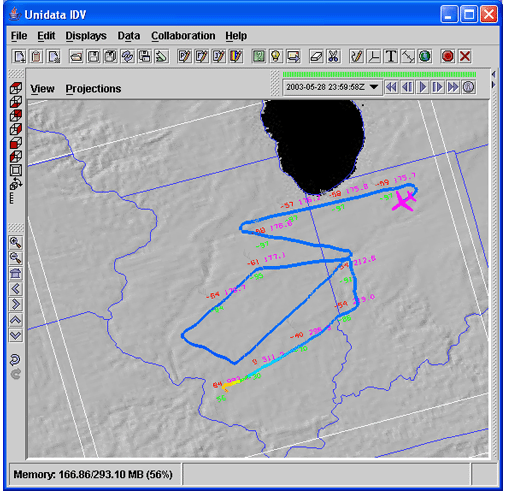
Aircraft and drifting buoy tracks can be plotted to show the path
of the sensor. You can also plot the track data as observations along with the
track.
 Image 3: Track display showing observations along the track and an airplane indicator at the end


 Unidata's Integrated Data Viewer > Appendix > Examples of Display Types


